06. Data Analysis Process Quiz
Data Analysis Process Quiz
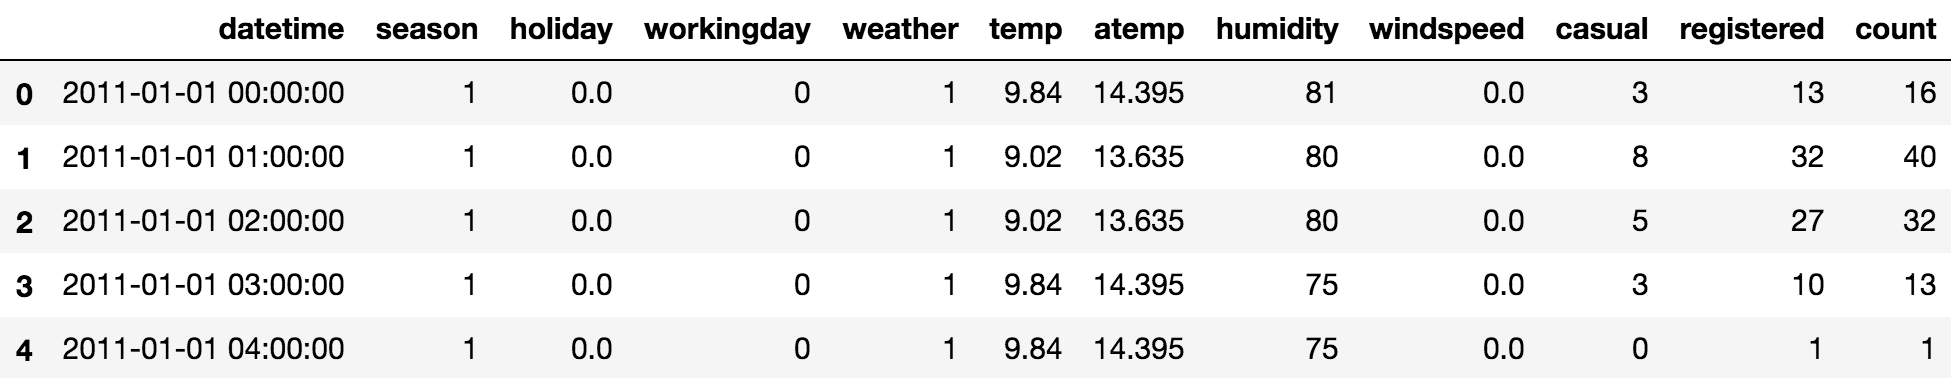
Let's build some intuition for the steps in the data analysis process with some questions you might have at each step. We'll use data from Kaggle's Bike Sharing Demand competition. In this dataset, you are given hourly rental data spanning two years from the Capital Bikeshare program in Washington, D.C. Below is a screenshot of the first 5 rows of this dataset. Note: This dataset has been slightly modified.
Note: Solutions to all quiz questions are provided in downloadable link at bottom of page.
Click on images to make them larger!
Use the table below to help you answer the first question. Each feature is a column in the dataset.
| Feature | Description |
|---|---|
| datetime | hourly date + timestamp |
| season | 1 = spring, 2 = summer, 3 = fall, 4 = winter |
| holiday | whether the day is considered a holiday |
| workingday | whether the day is neither a weekend nor holiday |
| weather * | 1, 2, 3, 4 (see descriptions below) |
| temp | temperature in Celsius |
| atemp | "feels like" temperature in Celsius |
| humidity | relative humidity |
| windspeed | wind speed |
| casual | number of non-registered user rentals initiated |
| registered | number of registered user rentals initiated |
| count | number of total rentals |
* Keys for Weather Feature
1 = clear, few clouds, partly cloudy, partly cloudy
2 = mist + cloudy, mist + broken clouds, mist + few clouds, mist
3 = light snow, light rain + thunderstorm + scattered clouds, light rain + scattered clouds
4 = heavy rain + ice pallets + thunderstorm + mist, snow + fog
Question Step
SOLUTION:
- Which attributes are most important in predicting the number of bikes rented?
- For which day of the week should the bikesharing company run promotions if the goal is to smooth out the number of rentals across the week?
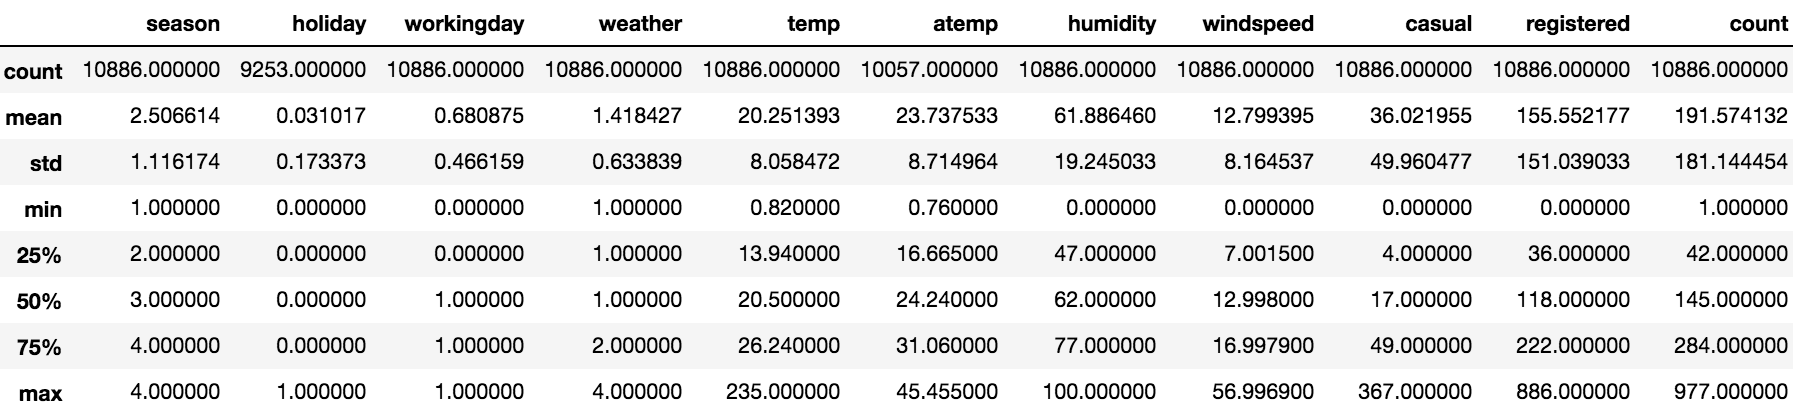
Helpful stats on each column for the next question
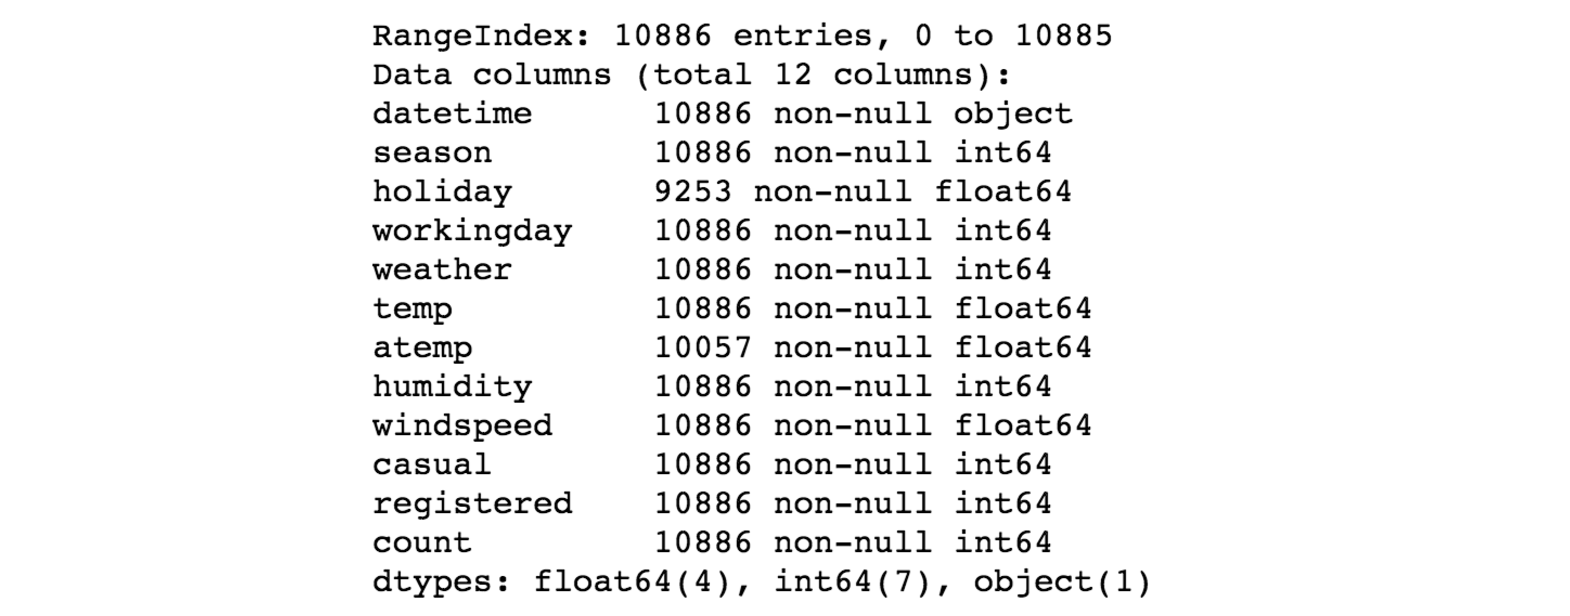
# Non-null values and datatype for each column
Wrangle Step
SOLUTION:
- Dates are not in date format
- Some values are missing
- Temperature values are far outside a realistic range on Earth
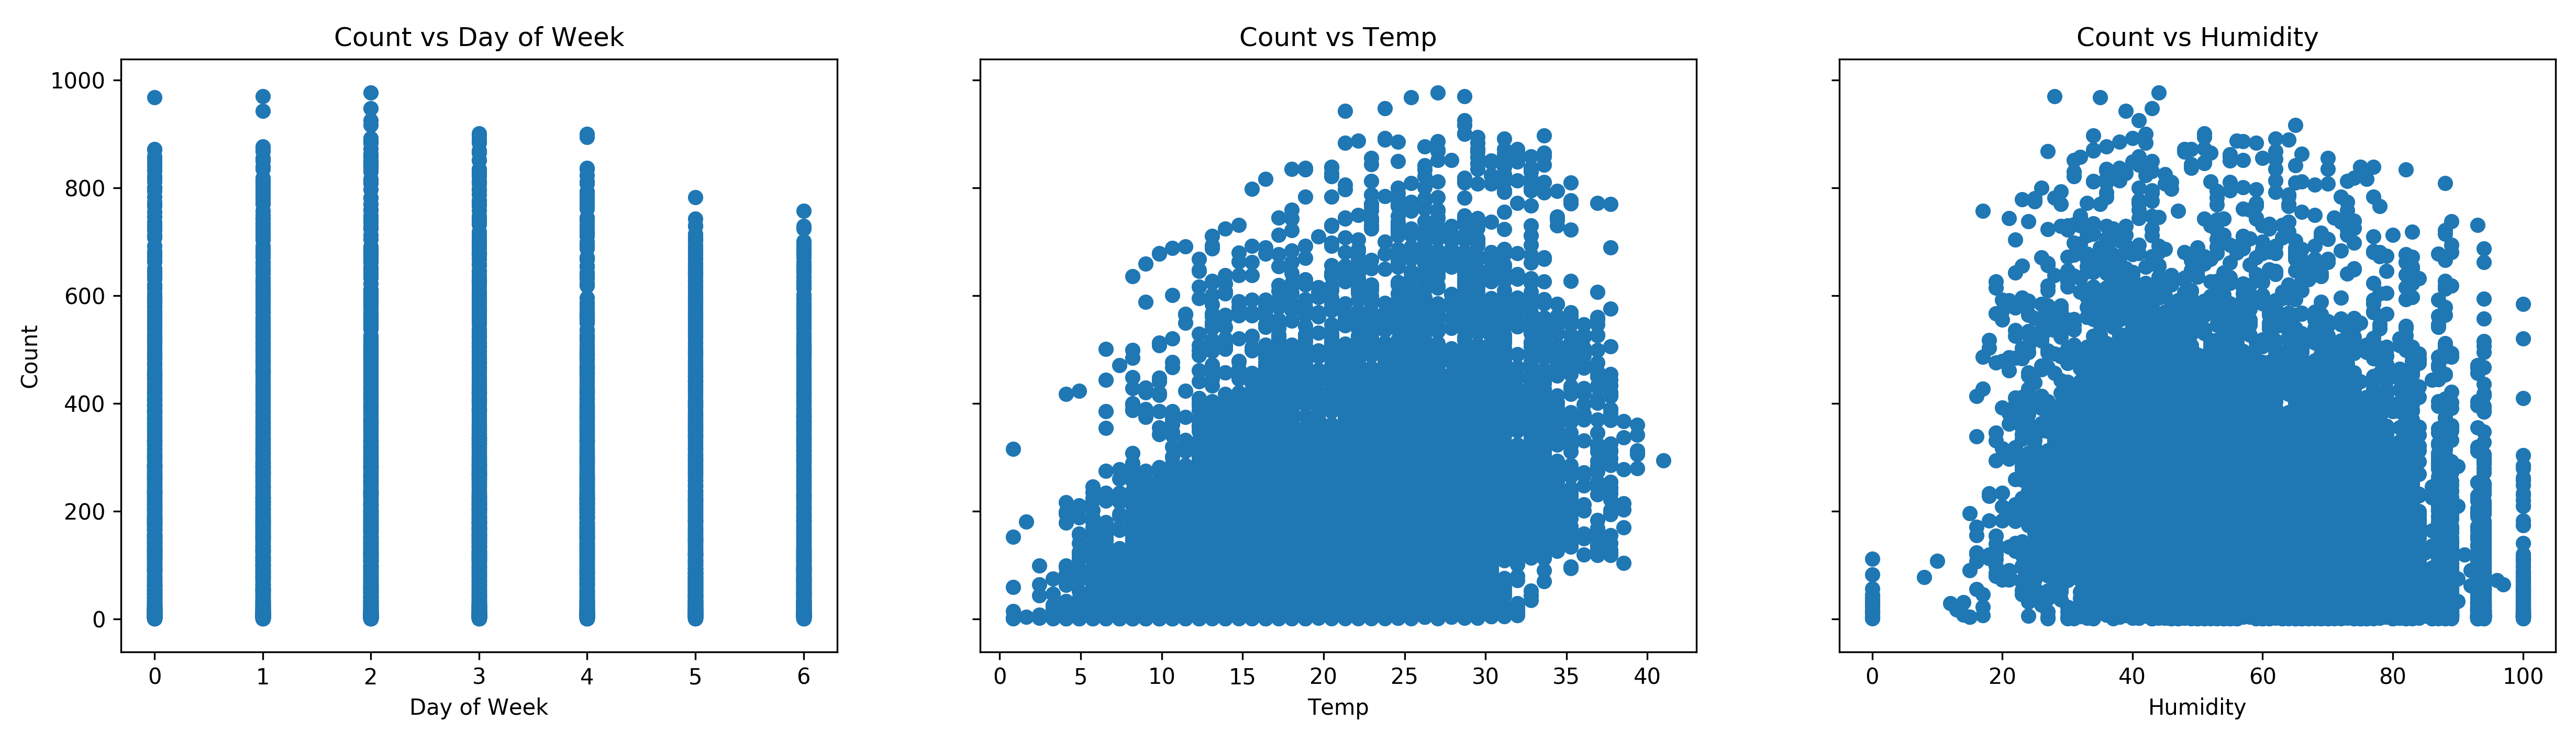
Scatterplots on the number of bikes rented vs. day of week, temperature, and humidity
Explore Step
SOLUTION:
Temperature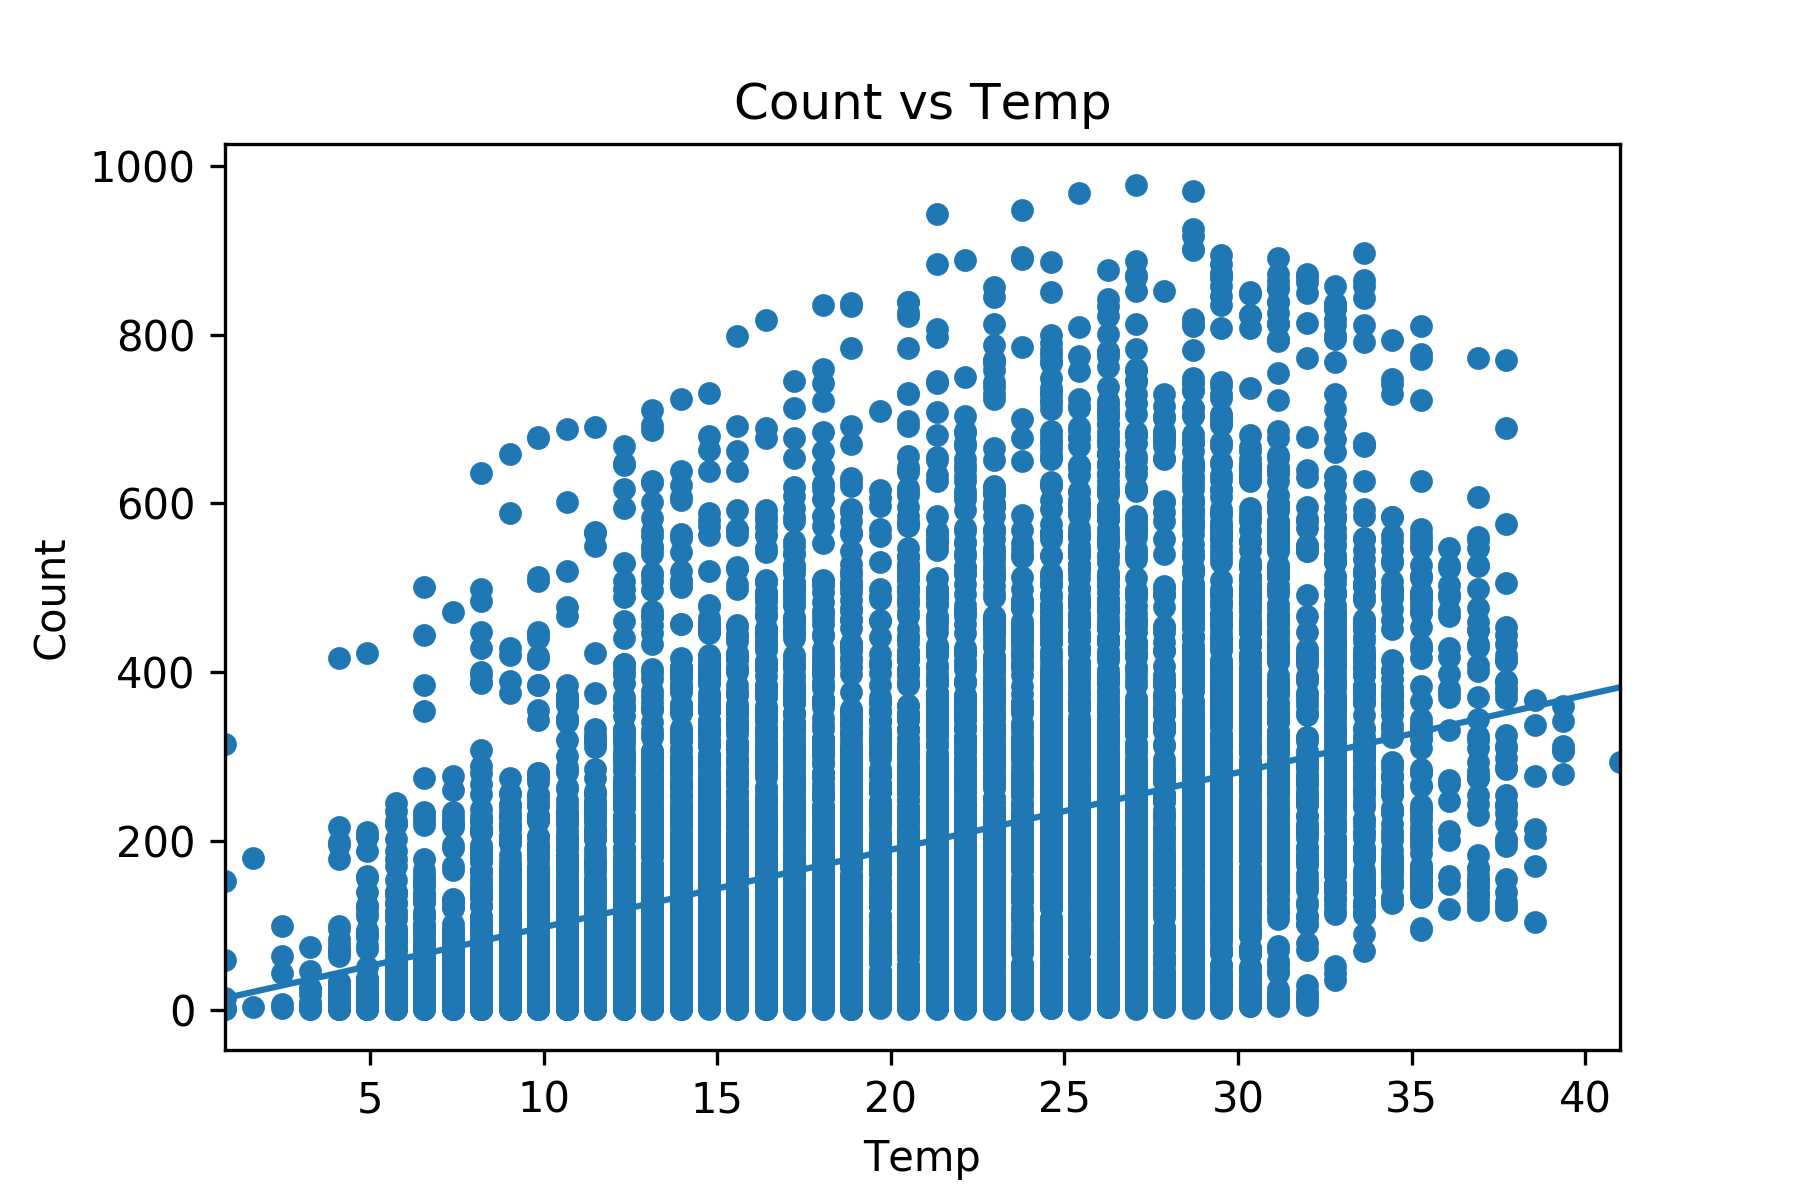
Scatter plot of count vs. temperature with a line of best fit for the next question
Draw Conclusions Step
SOLUTION:
250 bikesCommunicate Step
SOLUTION:
- A written report detailing the most important variables to consider when predicting the number of bike rentals
Great job! Next, let's learn about Python packages, which were used to prepare this quiz!